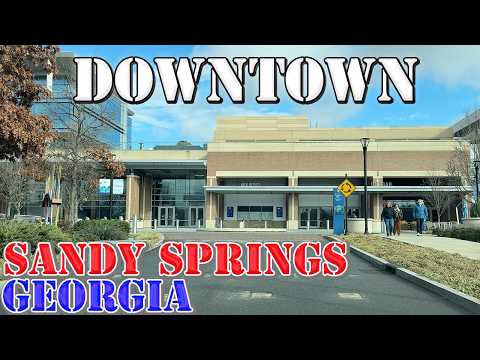
A DRIVE AROUND TOWN
Sandy Springs - Georgia - 4K Downtown Drive
A recorded city visit shared by Mileage Mike Travels. This is not a live camera or current conditions report.
Watch on YouTube ↗
Living here
What renters actually pay, by number of bedrooms, and how Sandy Springs compares with Georgia and the US.
Median rent
$1,789/mo
33% above US
1 bedroom
$1,612/mo
37% above US
2 bedrooms
$1,881/mo
41% above US
Renters paying 30%+ of income
43%
US 50%
Renter households
25,675
Median gross rent (contract rent plus utilities) for occupied rental units, by bedrooms. Income needed uses the 30% rule.
Nearby cities are other Local City Network guides in Georgia, nearest first.
At 30% of income you can spend about $1,881 a month.
Green means the median Sandy Springs rent for that size fits your budget. Landlords often ask for income of 2.5–3× the monthly rent.
43% of Sandy Springs renters spend 30% or more of their income on rent, and 22% spend half or more. The typical renter household puts 27.3% of its income toward rent (US: 50% and 25%).
Median gross rent for each ZIP Code Tabulation Area that overlaps Sandy Springs.
HUD’s 2027 fair market rents for Atlanta-Sandy Springs-Roswell, GA HUD Metro FMR Area are the payment benchmarks for housing vouchers (about the 40th percentile of recent movers’ rents), so they often differ from the medians above.
A DRIVE AROUND TOWN
A recorded city visit shared by Mileage Mike Travels. This is not a live camera or current conditions report.
Watch on YouTube ↗The median gross rent (rent plus utilities) is $1,789 a month, 37% above the Georgia median and 33% above the national median.
The median one-bedroom rents for $1,612 a month (US: $1,180).
The median two-bedroom rents for $1,881 a month (US: $1,338).
Using the common 30% rule, a median two-bedroom ($1,881) takes a household income of about $75,240 a year, and a one-bedroom about $64,480.
About 43% of Sandy Springs renters spend 30% or more of their income on rent, and 22% spend at least half (US: 50% and 25%).
Source: U.S. Census Bureau, American Community Survey 2019–2023 5-year estimates (tables B25031, B25070 and B25071). Estimates have margins of error; figures are in 2023 dollars.